Histograms
 Now I’d like to show you an example of natural selection to demonstrate that it is based on biased randomness. But first, I need to teach you what a histogram is. A histogram is a vertical bar graph, such as the one shown in Figure 1, in which the height of each bar represents the number of occurrences of an event. To demonstrate, let’s do another experiment. This time roll two (unweighted) six-sided dice and write down the sum of their numbers. I rolled a 3 and a 6, so I recorded 9. Now do it again. I got two 4s, so I recorded 8. Do this 98 more times. My results were 8, 4, 7, 8, 3, 11, 9, 9, 7, 7, 7, 7, 11, 10, 4, 11, 4, 11, 8, 6, 11, 6, 8, 7, 3, 8, 12, 8, 7, 3, 9, 7, 11, 10, 6, 9, 4, 6, 8, 8, 12, 6, 2, 5, 6, 10, 11, 4, 7, 10, 6, 7, 10, 9, 6, 5, 8, 6, 4, 9, 7, 9, 10, 8, 10, 8, 6, 8, 8, 7, 5, 6, 8, 6, 7, 9, 5, 10, 8, 8, 7, 8, 7, 10, 8, 3, 6, 7, 6, 7, 4, 8, 5, 9, 6, 7, 4, and 9.
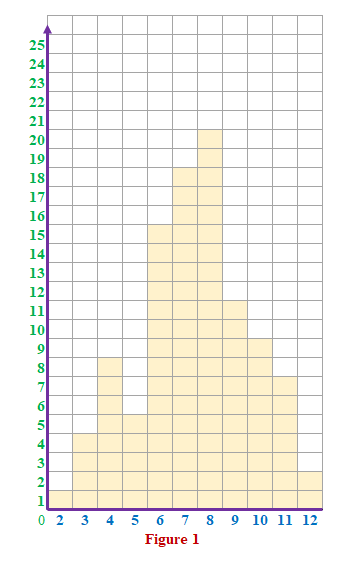
Next, get a piece of graph paper and write a horizontal line and a vertical arrow as shown in purple in Figure 1. Under the horizontal line, put a number in each box going from 2 to 12, as shown in blue in the figure. On the left side of the vertical arrow, put a number in each box with 0 at the bottom and incrementing the numbers as shown in green in the figure.
Count the number of times you recorded a 2. Fill in that many boxes above the blue 2. I rolled snake eyes (two ones) only once, so I filled in one box above the blue 2, as you can see in Figure 1 in yellow. Now do the same thing for the 3s. I recorded 3 four times, so I filled in four boxes above the 3. Continue doing this for the rest of the numbers. Congratulations. You have just created a histogram. My histogram is shown in Figure 1.
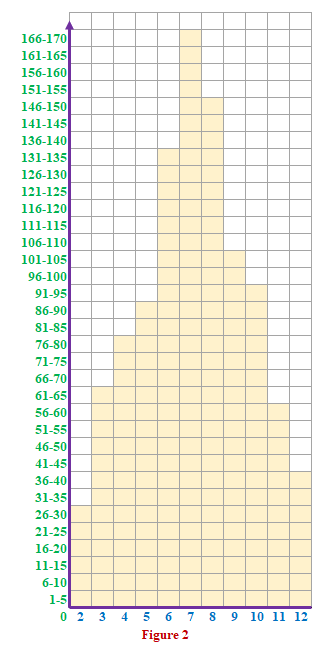
Your histogram should look similar to mine. Most of your results are sixes, sevens, and eights, and you have very few twos and twelves. But this isn’t guaranteed to be true because of the randomness. For example, I got more fours than fives, which I wouldn’t have expected. However, as you roll the dice more times, the probability that the histogram has the shape of a parabola increases. Figure 2 shows the histogram I got after rolling the dice a thousand times. (You might notice that I changed the green numbers to ranges so that the graph would fit on the page.)
This is biased randomness. If it was pure randomness, you would have recorded each number from 2 to 12 approximately the same number of times, so the top of the yellow area would have been basically flat.
Notice that, although randomness was involved in this exercise, the result was predictable: a parabola-shaped histogram. This illustrates a profound point: Structure can emerge naturally from randomness. In the next section, we will see that this principle applies to natural selection. Although there are random factors influencing which creatures survive to reproduce, the result has an underlying order.